










+9371.2%
About
A listed company
Broadcom is held by 31 of the portfolios Follow tracks, the largest position being Congress buys's at 11% of its book. The chart draws the held value of the share, dividends and splits counted, and carries the buys and sells of each holder on the days their filings place them.
Ondo Global Markets tokenises it as AVGOon on BNB Chain, so Follow can hold it in an account only you can withdraw from.
Holders
| Portfolio | |||||
|---|---|---|---|---|---|
11% | $3.2M | Jan 2014 | Sold · Sep 16 | +21.3% | |
6.5% | $13.1M | — | — | +11.0% | |
4.7% | $2.2B | Mar 2016 | Increased · Jun 30 | -4.1% | |
3.1% | $1.4B | Jun 2017 | Increased · Jun 30 | 0.0% | |
2.7% | $27.1M | Jan 2026 | Sold · Aug 28 | +13.2% | |
2.6% | $662.6M | Dec 2023 | Decreased · Jun 30 | -10.2% | |
2.3% | $4.9B | Mar 2016 | Increased · Jun 30 | +11.9% | |
2.3% | $1.2B | Sep 2024 | Increased · Mar 31 | +14.7% | |
2.2% | $1.6B | Jun 2020 | Increased · Sep 30 | +9.4% | |
2.1% | $4.8B | Mar 2016 | Increased · Mar 31 | +13.8% | |
2.1% | $24.9B | Mar 2016 | Decreased · Jun 30 | +14.8% | |
2% | $3.6B | Jun 2018 | Increased · Sep 30 | +12.6% | |
1.9% | $1.2B | Mar 2016 | Decreased · Mar 31 | +12.7% | |
1.8% | $497.8M | Sep 2023 | Decreased · Jun 30 | +8.6% | |
1.6% | $37.8K | May 2025 | Bought · Aug 26 | +15.7% | |
1.2% | $25K | Sep 2017 | Sold · Apr 13 | +25.6% | |
1.1% | $49K | Jul 2024 | Bought · Mar 31 | +14.5% | |
0.9% | $325.6K | Oct 2025 | Sold · Sep 16 | +12.6% | |
0.8% | $689.8M | Dec 2015 | Decreased · Jun 30 | +12.9% | |
0.8% | $153.8M | Mar 2026 | New position · Mar 31 | +1.4% | |
0.8% | $212K | Jul 2025 | Bought · Sep 17 | +16.9% | |
0.7% | $56.7M | Sep 2019 | New position · Jun 30 | +0.7% | |
0.7% | $62.4M | Mar 2016 | New position · Dec 31 | +1.6% | |
0.4% | $513M | Mar 2026 | Increased · Jun 30 | -10.6% | |
0.4% | $7.7K | — | — | +11.0% | |
0.4% | $386.6M | Jun 2016 | Decreased · Jun 30 | +16.1% | |
0.4% | $321M | Jun 2016 | Increased · Mar 31 | +5.2% | |
0.2% | $127.6M | Dec 2016 | Increased · Sep 30 | +13.5% | |
0.2% | $22.6M | Mar 2022 | Decreased · Jun 30 | -2.6% | |
0.1% | $27.8K | May 2023 | Bought · Jun 25 | +7.5% | |
0% | $2.2M | Mar 2016 | New position · Jun 30 | +15.0% |
Activity
 −$1k–$15kTraded Sep 16, 2026Disclosed Oct 12, 2026
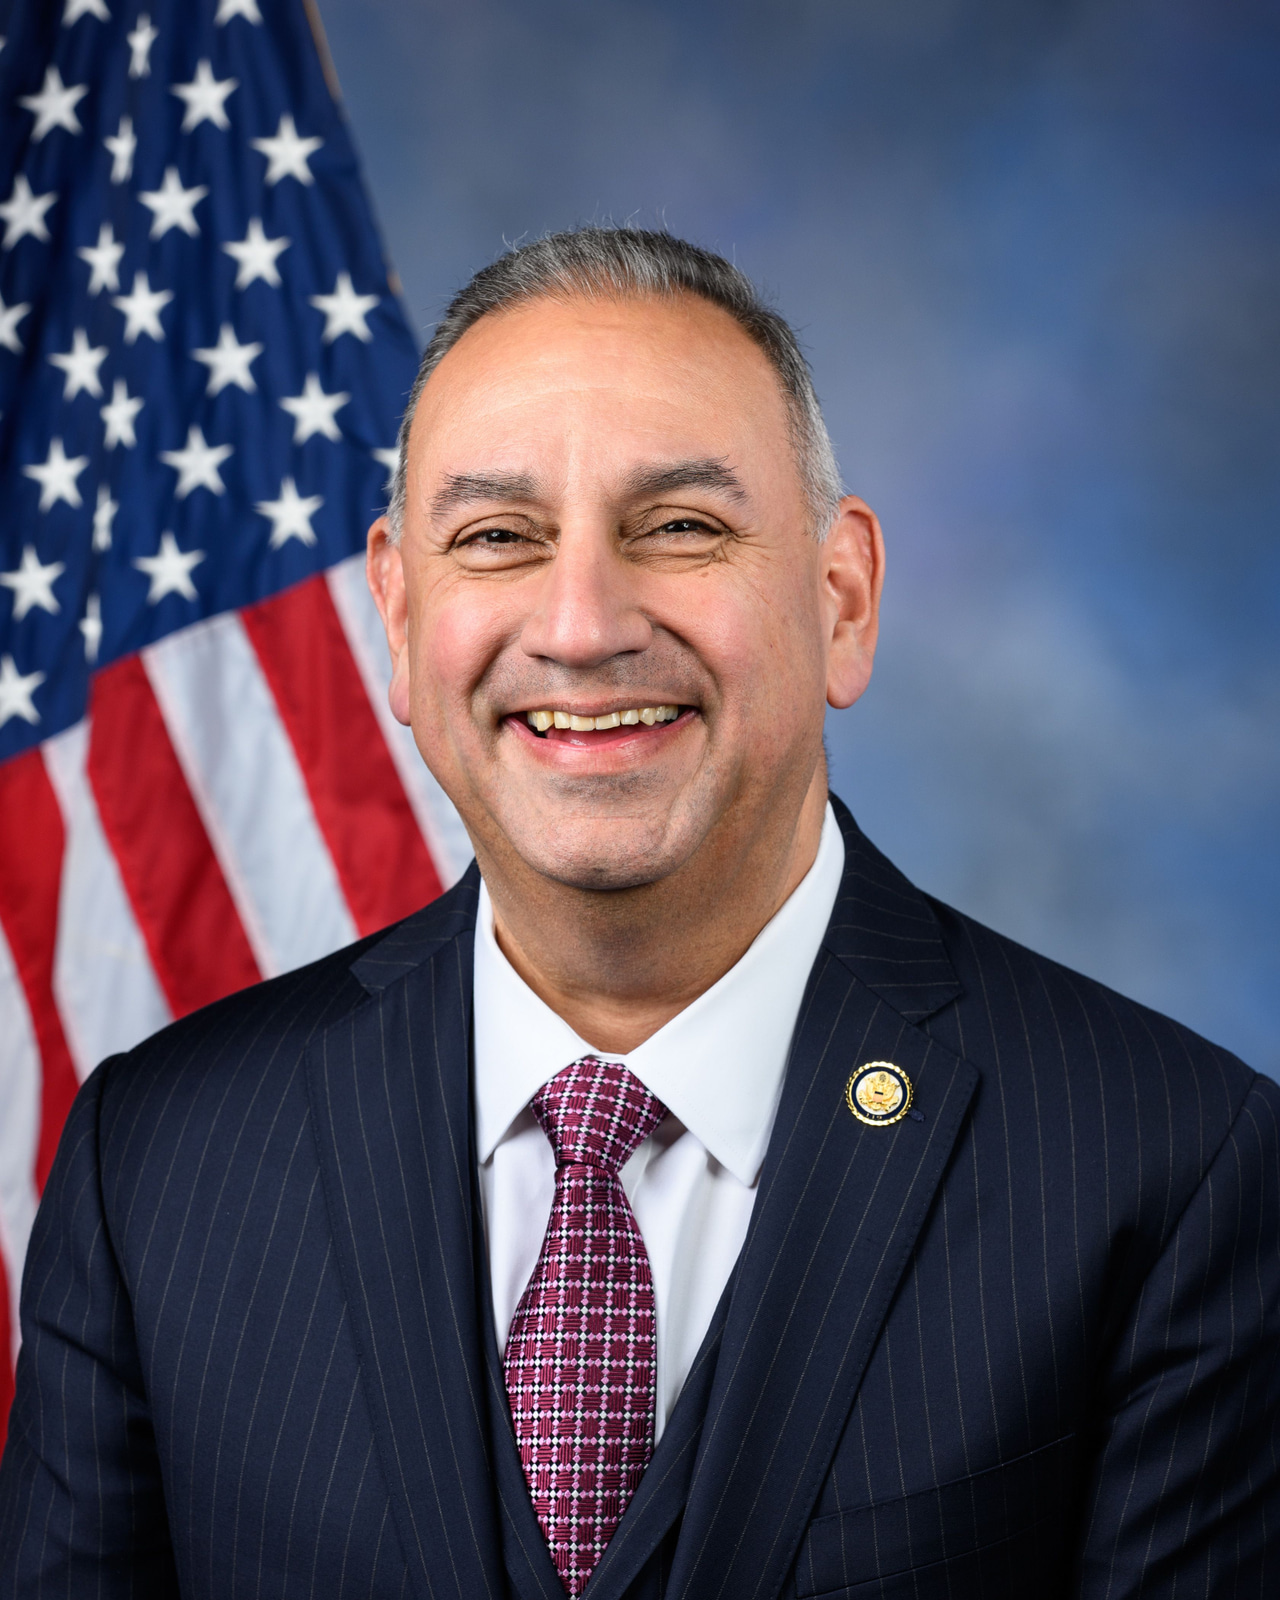 Gil CisnerosSold−$1k–$15kTraded Sep 16, 2026Disclosed Oct 12, 2026
 Donald TrumpSold−$1k–$15kTraded Aug 28, 2026Disclosed Oct 6, 2026
- +$1k–$15k ×2Traded Aug 26, 2026Disclosed Sep 5, 2026
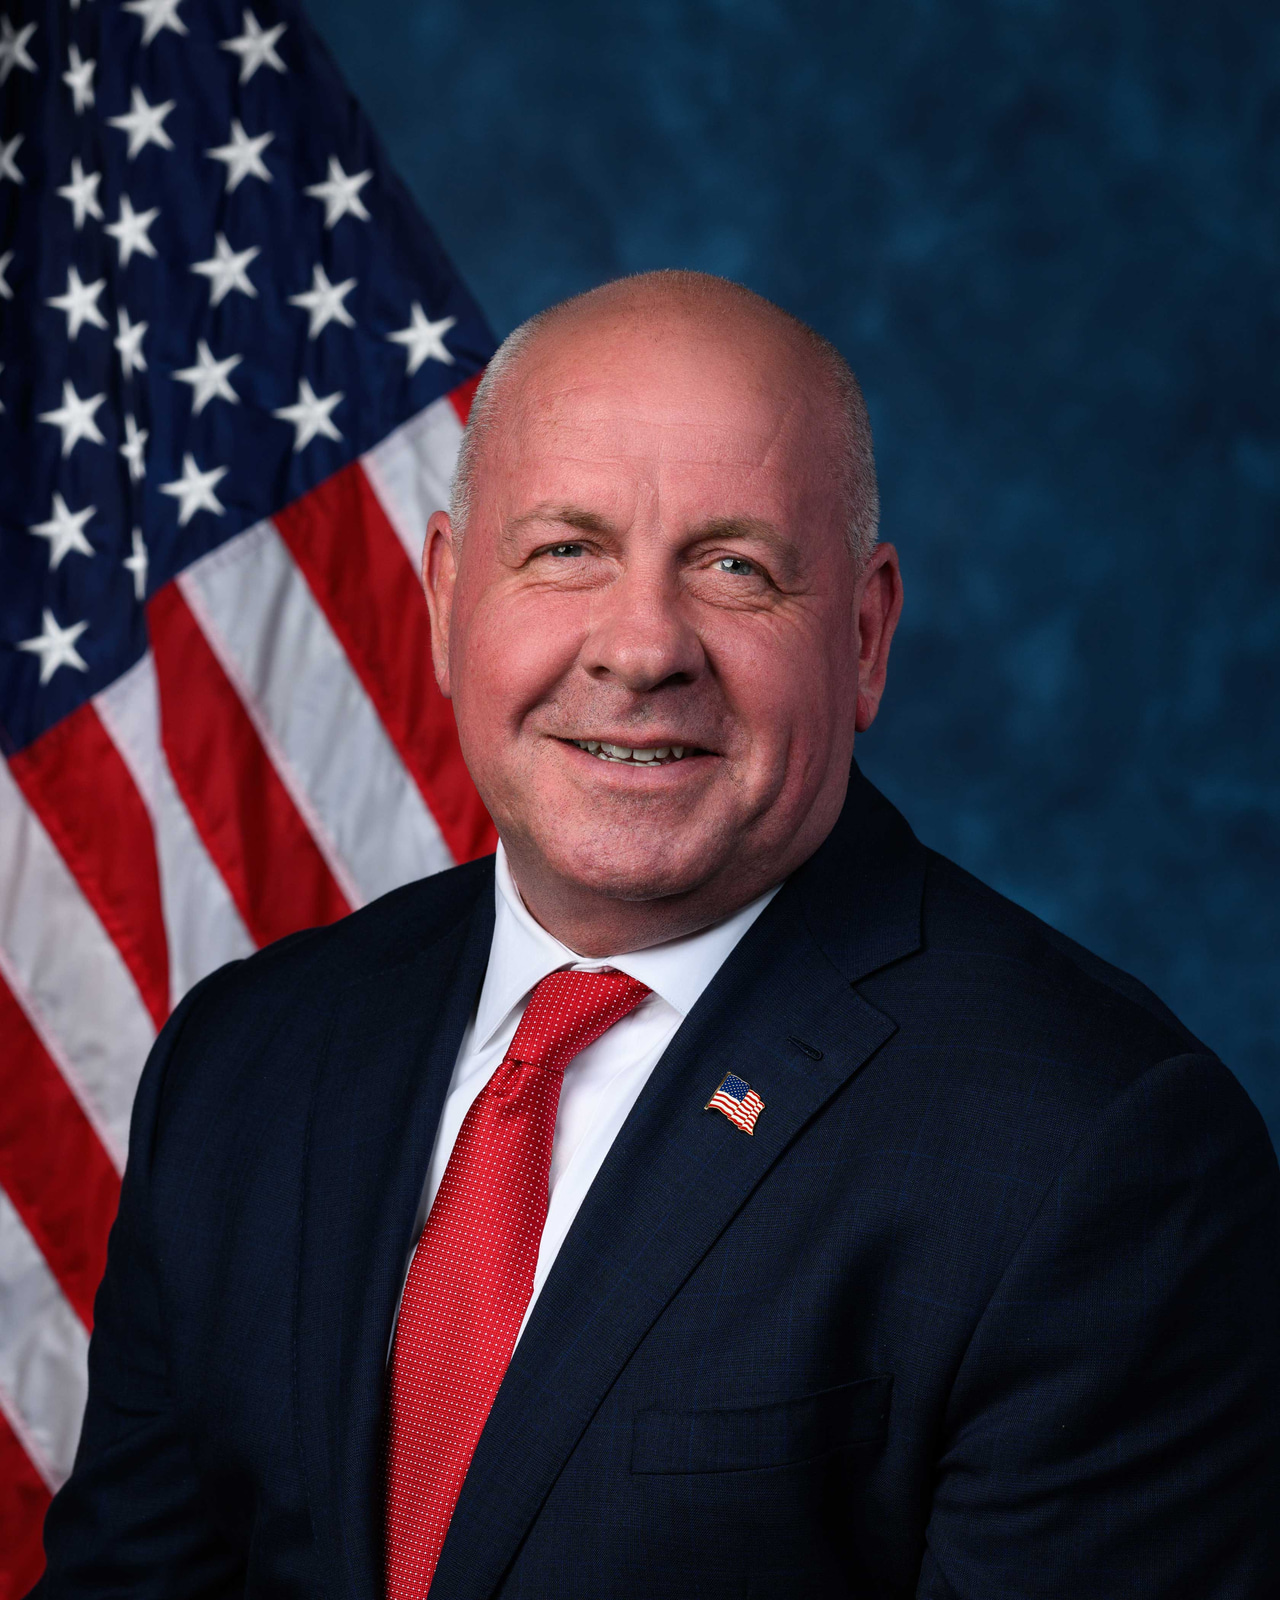 David TaylorBought+$1k–$15k ×2Traded Aug 26, 2026Disclosed Sep 5, 2026
- Donald TrumpBought+$15k–$50kTraded Aug 26, 2026Disclosed Oct 6, 2026
- −$1k–$15kTraded Aug 24, 2026Disclosed Sep 4, 2026
- Donald TrumpSold−$500k–$1mTraded Aug 21, 2026Disclosed Oct 6, 2026
- +$1k–$15kTraded Aug 12, 2026Disclosed Sep 22, 2026
- +$15k–$50kTraded Aug 3, 2026Disclosed Sep 4, 2026
- Donald TrumpBought+$250k–$500kTraded Jul 31, 2026Disclosed Sep 18, 2026
- +$1k–$15kTraded Jul 24, 2026Disclosed Aug 6, 2026
- David TaylorBought+$1k–$15kTraded Jul 24, 2026Disclosed Aug 6, 2026
- +$1k–$15kTraded Jul 20, 2026Disclosed Aug 7, 2026
- Donald TrumpSold−$1k–$15kTraded Jul 17, 2026Disclosed Sep 18, 2026
- +$1k–$15kTraded Jul 14, 2026Disclosed Aug 18, 2026
- Donald TrumpBought+$1k–$15kTraded Jul 1, 2026Disclosed Sep 18, 2026
 Altimeter CapitalClosed−$20.8m · 0.4% → 0%Sold Apr 1 – Jun 30, 2026Disclosed Aug 14, 2026
 Appaloosa ManagementNew position+$56.7m · 0% → 0.7%Bought Apr 1 – Jun 30, 2026Disclosed Aug 14, 2026
 Baillie GiffordIncreased+$477m · 0% → 0.5%Bought Apr 1 – Jun 30, 2026Disclosed Aug 6, 2026
 Bridgewater AssociatesDecreased−$195m · 2.5% → 2%Sold Apr 1 – Jun 30, 2026Disclosed Aug 14, 2026
 CDPQDecreased−$139m · 1.1% → 1%Sold Apr 1 – Jun 30, 2026Disclosed Aug 14, 2026
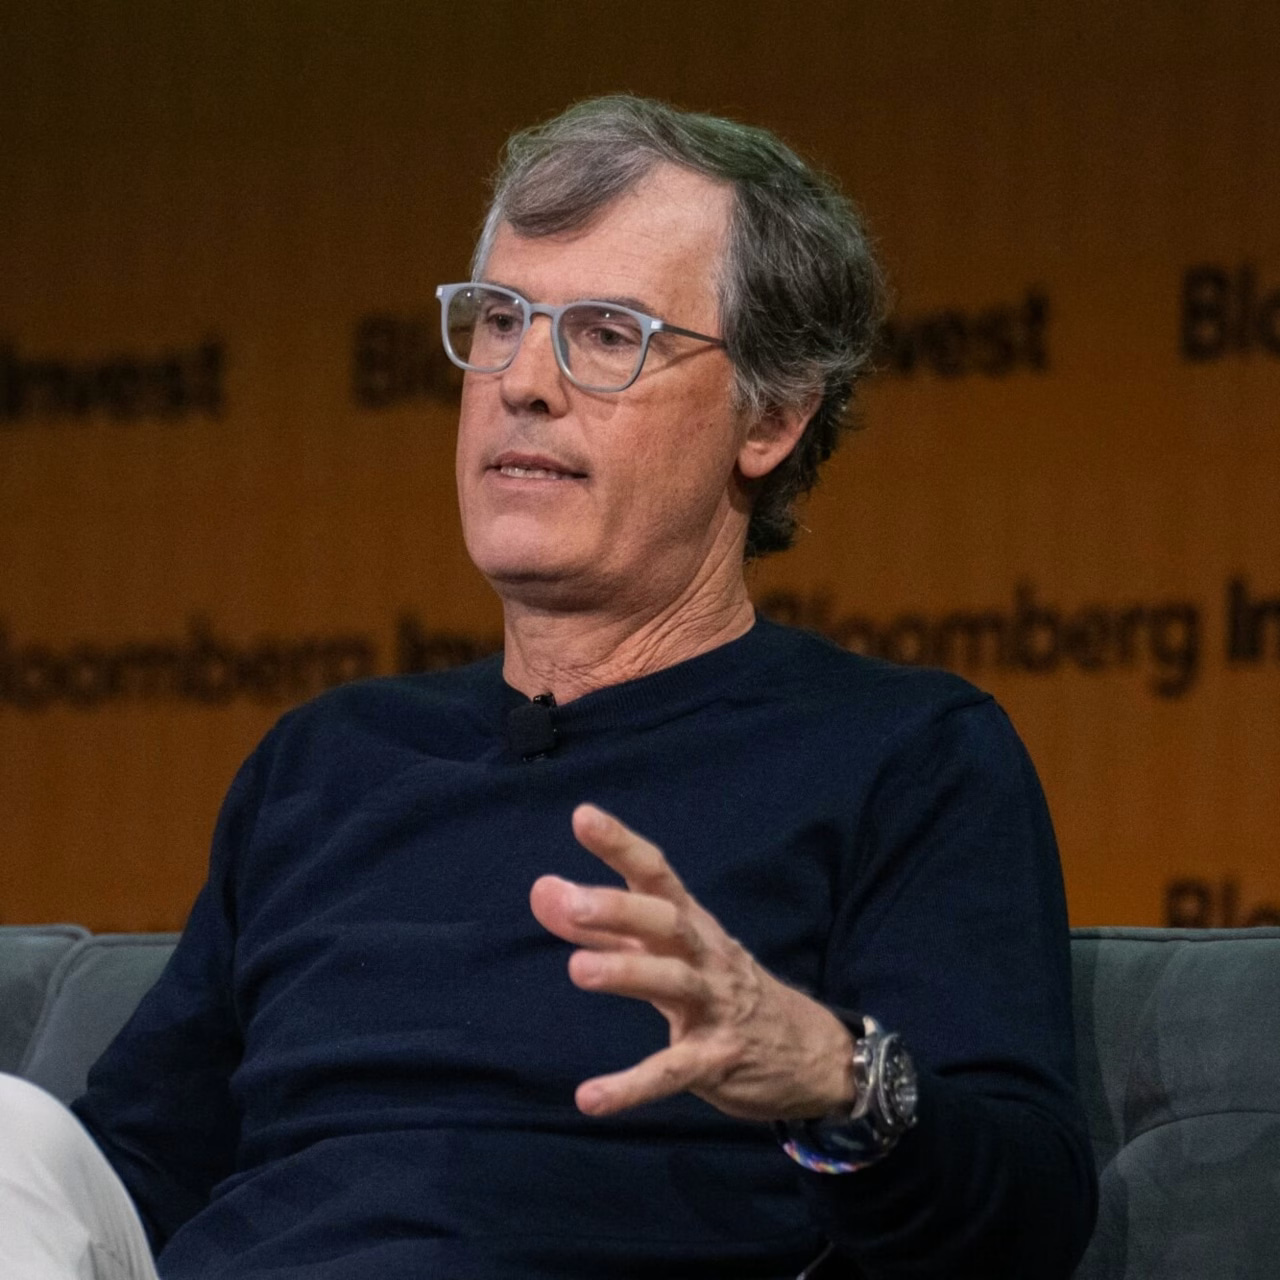 Coatue ManagementIncreased+$130m · 5.9% → 4.5%Bought Apr 1 – Jun 30, 2026Disclosed Aug 14, 2026
 CPP InvestmentsIncreased+$1.03bn · 2.1% → 2.7%Bought Apr 1 – Jun 30, 2026Disclosed Aug 14, 2026
 D1 CapitalClosed−$304m · 2.7% → 0%Sold Apr 1 – Jun 30, 2026Disclosed Aug 14, 2026
 Duquesne Family OfficeClosed−$60.6m · 1.8% → 0%Sold Apr 1 – Jun 30, 2026Disclosed Aug 14, 2026
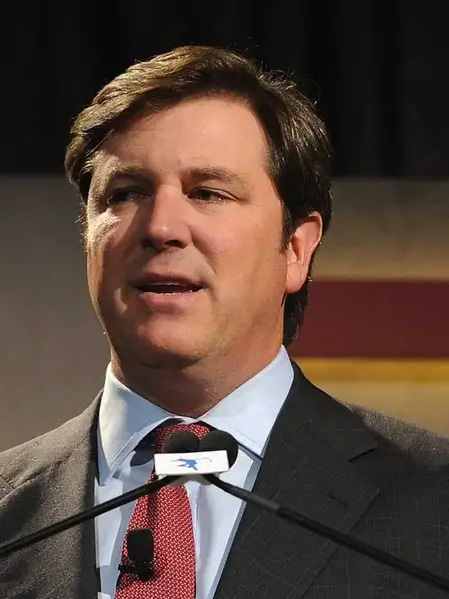 Maverick CapitalNew position+$2.17m · 0% → 0%Bought Apr 1 – Jun 30, 2026Disclosed Aug 14, 2026
 Norway's Oil FundDecreased−$1.55bn · 2.6% → 2.5%Sold Jan 1 – Jun 30, 2026Disclosed Aug 12, 2026
 Point72Decreased−$469m · 0.9% → 0.4%Sold Apr 1 – Jun 30, 2026Disclosed Aug 14, 2026
 Temasek HoldingsIncreased+$75.6m · 3.6% → 3.8%Bought Apr 1 – Jun 30, 2026Disclosed Aug 7, 2026
 Third PointClosed−$15.5m · 0.7% → 0%Sold Apr 1 – Jun 30, 2026Disclosed Aug 14, 2026
 Tiger GlobalDecreased−$692m · 4.9% → 2.8%Sold Apr 1 – Jun 30, 2026Disclosed Aug 14, 2026
 Whale Rock CapitalDecreased−$256m · 2.9% → 0.2%Sold Apr 1 – Jun 30, 2026Disclosed Aug 14, 2026
- Donald TrumpSold−$50k–$100kTraded Jun 24, 2026Disclosed Aug 20, 2026
- +$1k–$15kTraded Jun 16, 2026Disclosed Jul 6, 2026
- Donald TrumpBought+$1k–$15kTraded Jun 16, 2026Disclosed Aug 20, 2026
- Donald TrumpBought+$100k–$250kTraded Jun 15, 2026Disclosed Aug 20, 2026
- Donald TrumpBought+$15k–$50kTraded Jun 15, 2026Disclosed Aug 20, 2026
- +$15k–$50kTraded Jun 5, 2026Disclosed Jul 6, 2026
- Donald TrumpSold−$100k–$250kTraded Jun 2, 2026Disclosed Aug 20, 2026
- Donald TrumpSold−$100k–$250kTraded May 18, 2026Disclosed Jun 30, 2026
- Donald TrumpBought+$1k–$15kTraded May 15, 2026Disclosed Jun 30, 2026
- Donald TrumpSold−$500k–$1mTraded May 14, 2026Disclosed Jun 30, 2026
- −$1k–$15k ×2Traded Apr 27, 2026Disclosed May 7, 2026
- David TaylorSold−$1k–$15k ×2Traded Apr 27, 2026Disclosed May 7, 2026
- Donald TrumpBought+$250k–$500kTraded Apr 27, 2026Disclosed Jun 30, 2026
- Donald TrumpBought+$50k–$100kTraded Apr 27, 2026Disclosed Jun 30, 2026
- Donald TrumpSold−$15k–$50kTraded Apr 27, 2026Disclosed Jun 30, 2026
- Donald TrumpBought+$50k–$100kTraded Apr 15, 2026Disclosed Jun 30, 2026
- +$1k–$15kTraded Apr 13, 2026Disclosed May 11, 2026